Greetings from InfraVis Director Monica Billger and the Management Team
|
This autumn, I am encouraged to see how research infrastructures are finding new ways to work together. Increasingly, they are being connected across the full research workflow rather than operating as separate resources, and AI is becoming an important driver of this development. In this issue, you can read more about one initiative that points in this direction.
Monica Billger | | | |
InfraVis annual open call 2026
Turn your data into new insights!
Apply for InfraVis' annual in-depth support call, open 1–31 October, and collaborate with a multidisciplinary team that can help you get more from your research data and take your research further.
We are holding a workshop to help you prepare your application and make the most of this opportunity: Wednesday 30 September, 14:00–16:00 |
For the InfraVis 2026 call, InfraVis may select a limited number of projects for full or partial subsidy. Applicants who wish to be considered for such support should indicate this in their application. Applications will first be assessed against the Application Requirements, after which the impact of visualization support, as well as the potential for development of reusable and scalable tools will be considered. This type of support will only be reserved for highly ranked applications and awarded based on the merits of the application. | | | |
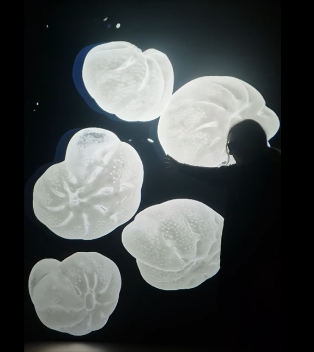
Foraminifera
Photo: Helena Filipsson |
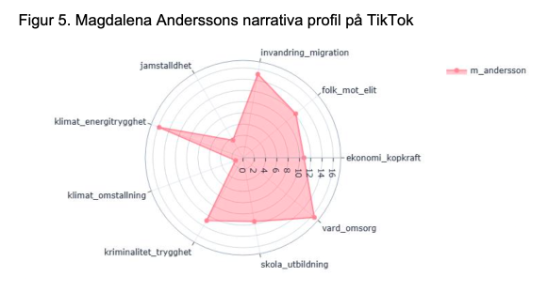
Politician's narrative profile on TikTok
Screenshot: Kajsa Falasca | | Voices from InfraVis users:
”With InfraVis, we have been able to visualize and share complex 3D data from marine microfossils, making it accessible beyond our field. This has opened up entirely new possibilities for environmental research, allowing us to detect patterns and insights we could not see before.” Helena Filipsson, Professor in Geology, Lund University.
"Without the interactive visualization environment developed by InfraVis, it would have been considerably more difficult to identify and explore the patterns in communication and engagement that underpin our scientific findings." Kajsa Falasca, Associate Professor in Media & Communication, Mid Sweden University.
| | | |
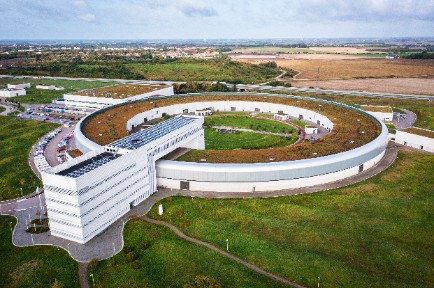
MAX IV
Photo: Lund University |
Kajsa M. Paulsson, Vice Director, InfraVis
Photo: Lund University | |
From experiment to insight: connecting three national research infrastructures
MAX IV, NAISS and InfraVis are working together to connect data generation, high-performance computing, analysis and visualization in a seamless workflow for researchers. The collaboration was initiated by InfraVis and builds on several years of development work between InfraVis and both MAX IV and NAISS. By bringing together the complementary strengths of the three national research infrastructures, the initiative aims to help researchers move more efficiently from experiments to scientific insight.
A key objective is to create integrated workflows that connect experiments, computing, analysis and visualization. Researchers will be able to process large volumes of data generated at MAX IV using national computing and AI resources provided by NAISS, while new visualization and analysis tools help them explore results and assess data quality. The collaboration also investigates AI-supported and multimodal approaches for combining and interpreting complex datasets.
“What makes this collaboration particularly valuable is that it connects national research infrastructures around the researchers’ full workflow, rather than treating data generation, computing, analysis and visualization as separate steps,” says Kajsa M Paulsson, Vice Director of InfraVis. “By working together, we can make advanced resources easier to use and create greater value across the whole chain.”
The project demonstrates how connected national research infrastructures can strengthen the full chain from experiment to insight and enable research that would be difficult to achieve through any one infrastructure alone. | | | |
InfraVis Expo 2026
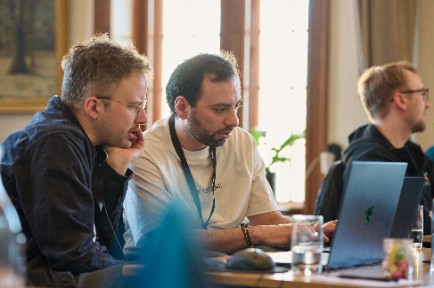
Around 40 researchers, infrastructure staff and support experts gathered at the 2026 InfraVis Expo at Lund University for a day of presentations, demonstrations, posters and discussions. The programme showcased InfraVis-supported research projects, application expert perspectives, and contributions from several Lund University research infrastructures.
One of the highlights was the panel discussion “Stronger together – how collaboration between research infrastructures benefits researchers.” The conversation explored how researchers can more easily access the expertise, instruments, computing resources and visualization support they need in an increasingly complex landscape. Discussions emphasized closer collaboration between infrastructures, FAIR data practices and seamless workflows. Participants also explored visualization demos, VR applications and poster presentations, while new connections and collaborations emerged throughout the day.
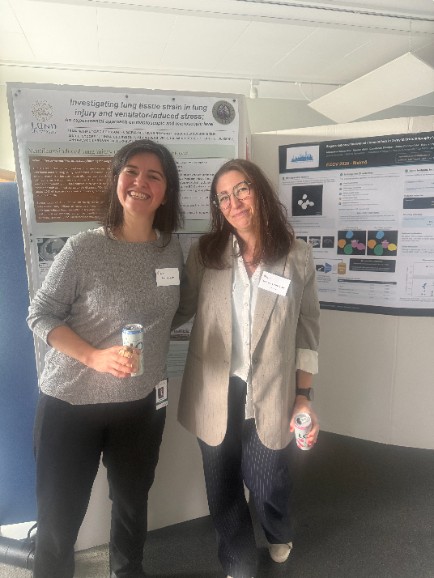
| | Denise de Roux and Irma Mahmutovic-Persson
Photo: Kajsa M Paulsson | | | | InfraVis support projects
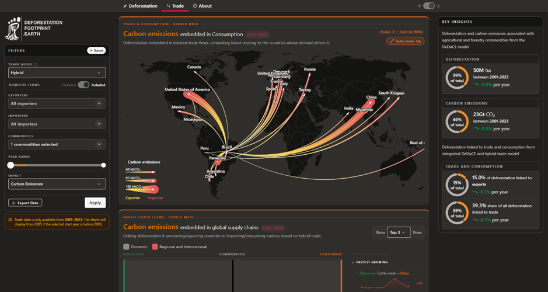
| Screenshot from the platform | |
Forest to fork - visualizing the global footprint of deforestation
InfraVis supported the development of an interactive web platform based on the DeDuCE model, which tracks commodity-driven deforestation and carbon emissions across more than 180 countries.
Combining environmental and trade data, the platform reveals links between production, trade and consumption through interactive maps and visualizations. The publicly available tool helps researchers, policymakers and other stakeholders explore deforestation trends and supply-chain impacts while making complex data accessible without compromising scientific accuracy.
Read more about this project on InfraVis website. | | | | Photo from the touchscreen installation | |
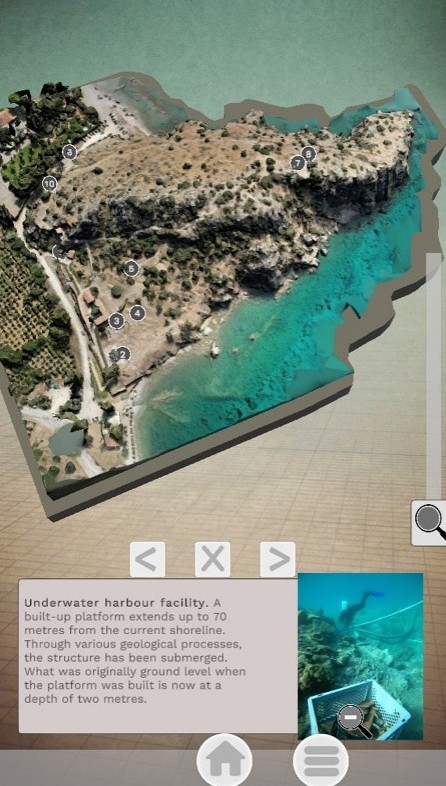
PAST: Archaeology through digital storytelling
PAST – Platsen Asine Spår och Tid brings archaeological heritage to life through an interactive installation at Gustavianum Museum in Uppsala. Focusing on the ancient Greek site of Asine, the project combines 3D models, photographs, maps and archival material to show how archaeological knowledge is created. Building on an earlier InfraVis-supported project, it makes both heritage and research processes accessible to a wider audience. The project has also resulted in a scientific article exploring how digital visualization can communicate archaeological research and engage museum visitors. | | | | Photo:
Costanza Julia Bani
| |
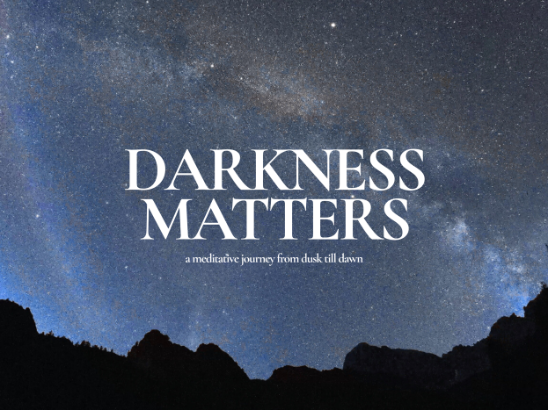
Darkness Matters: visualising the future of light pollution
Darkness Matters is a fulldome documentary and research project raising awareness of the growing impact of light pollution. Through support from InfraVis, the project combined NASA satellite-based skyglow modelling with an interactive VR experience, allowing users to explore how featured landscapes may be affected by future light pollution. Using visualization, spatial analysis and immersive technology, the project transforms complex environmental data into an engaging experience that highlights the long-term consequences of artificial light on natural environments and wildlife. | | | | Photo: Digital Twin Cities Centre | |
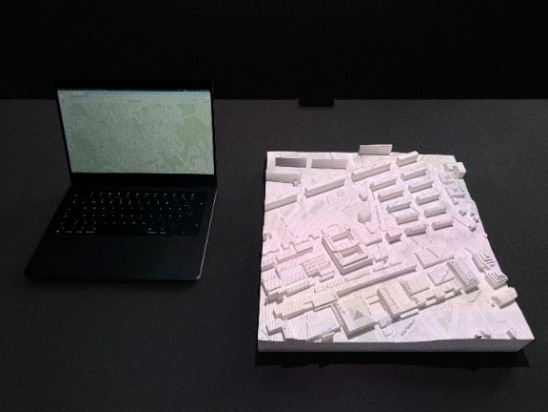
Bringing digital twins into the physical world
The Digital Twin Lab transforms urban digital twins from on-screen simulations into tangible, interactive experiences. Using calibrated projection on 3D-printed city models, researchers, planners and communities can explore geospatial and simulation data together around a shared physical interface. Designed to be affordable, portable and easy to operate, the lab lowers barriers to participation and decision-making. Current developments include AI-assisted automatic calibration and hands-free interaction. Co-funded by DTCC (Digital Twin Cities Centre) and InfraVis, this InfraVis development project demonstrates how digital twins can support research, public engagement and urban planning in an accessible and collaborative way.
| | | | Screenshot from the visualization tool | |
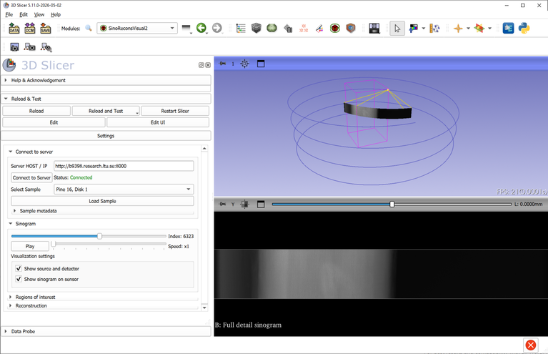
Visualizing CT data in real time
Through the InfraVis Call 2025, researchers Ozan Öktem and Oualid Burström partnered with InfraVis to develop a tool for real-time visualization of CT sinograms, the raw data generated during computed tomography scans. The solution enables researchers to inspect large datasets before running time-consuming reconstruction algorithms, helping them identify measurement issues and regions of interest early. By combining efficient data compression, streaming technology and interactive visualization, the tool makes it possible to explore terabyte-scale datasets in real time. It also supports the development and testing of new reconstruction methods and has been presented to the wider wood science community.
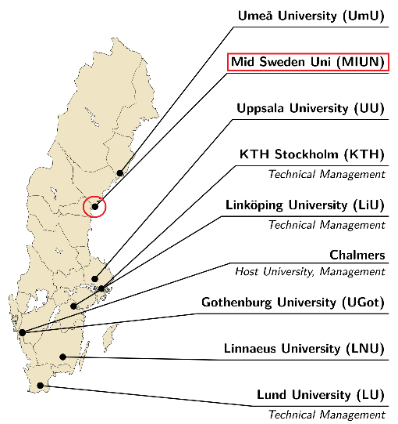
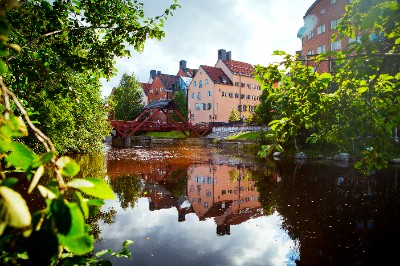
The plugin is available on open source | | | | Mid Sweden University Photo: Casper Hedberg | | InfraVis consists of eight nodes, based at nine universities, from Umeå in the north to Lund in the south.
| Spotlight on the Mid-Sweden University node
The InfraVis node at Mid Sweden University brings together a team of five experts, including an embedded expert, with strengths in 3D visualization, image and video processing, computer vision, immersive video technologies, light-field research and frontend development. The node also offers specialized laboratory facilities for virtual reality development, image processing, light-field research and robotic remote control systems.
These capabilities are integrated directly into InfraVis projects, supporting researchers with advanced visualization and image-processing solutions. A recent example involved researcher Kajsa Falasca, who highlighted the value of the collaboration for both a published research report and the future development of analysis methods. (Read more here). The node's combination of technical expertise, curiosity and problem-solving helps researchers explore new ways of understanding, communicating and developing their research through visualization.
| | | |
InfraVis – Visualization & Dimensionality Reduction
InfraVis is holding a satellite event to the conference Swedish e-Science Academy. - when: 13 October, 09:00-16:00
- where: Uppsala
The conference is held 14-15 October 2026, with satellite events 13-16 October. Read more
| | | | From InfraVis Days at Linnaeus University 2026 Photo: Henrik Andersson | |
Upcoming InfraVis DaysIn November, the bi-annual internal event InfraVis Days will be held outside Stockholm, bringing together colleagues from all eight nodes. This time, focus will be on the applications from the open annual call, develop skills and exchange knowledge, and to continue on building on a tight collaboration between our eight nodes. | | | | | | Follow InfraVis on Social Media | | | | | If you have news, suggestions or ideas relevant for InfraVis and data visualization, please let us know by emailing info@infravis.se Unsubscribe | |