Greetings from InfraVis Director Monica Billger and the Management Team
|
As an intense period gives way to summer, it is encouraging to see how much has moved forward. Projects from our latest call are now fully underway, while others have recently reached completion, reflecting strong progress across InfraVis. At the same time, we are developing our concept of embedded experts, adding new momentum to our collaborations across Sweden. This will further strengthen how we support our users and partners. I wish you all a well-deserved and restful summer. Monica Billger
| | | | We are here for you!
In October 2026, InfraVis' fourth call for applications will open, but we are always here to help: | | | | |
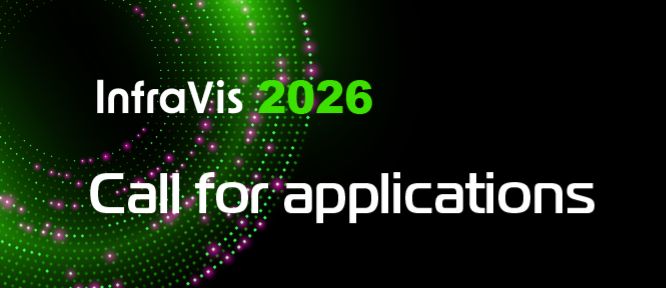
InfraVis annual open call 2026
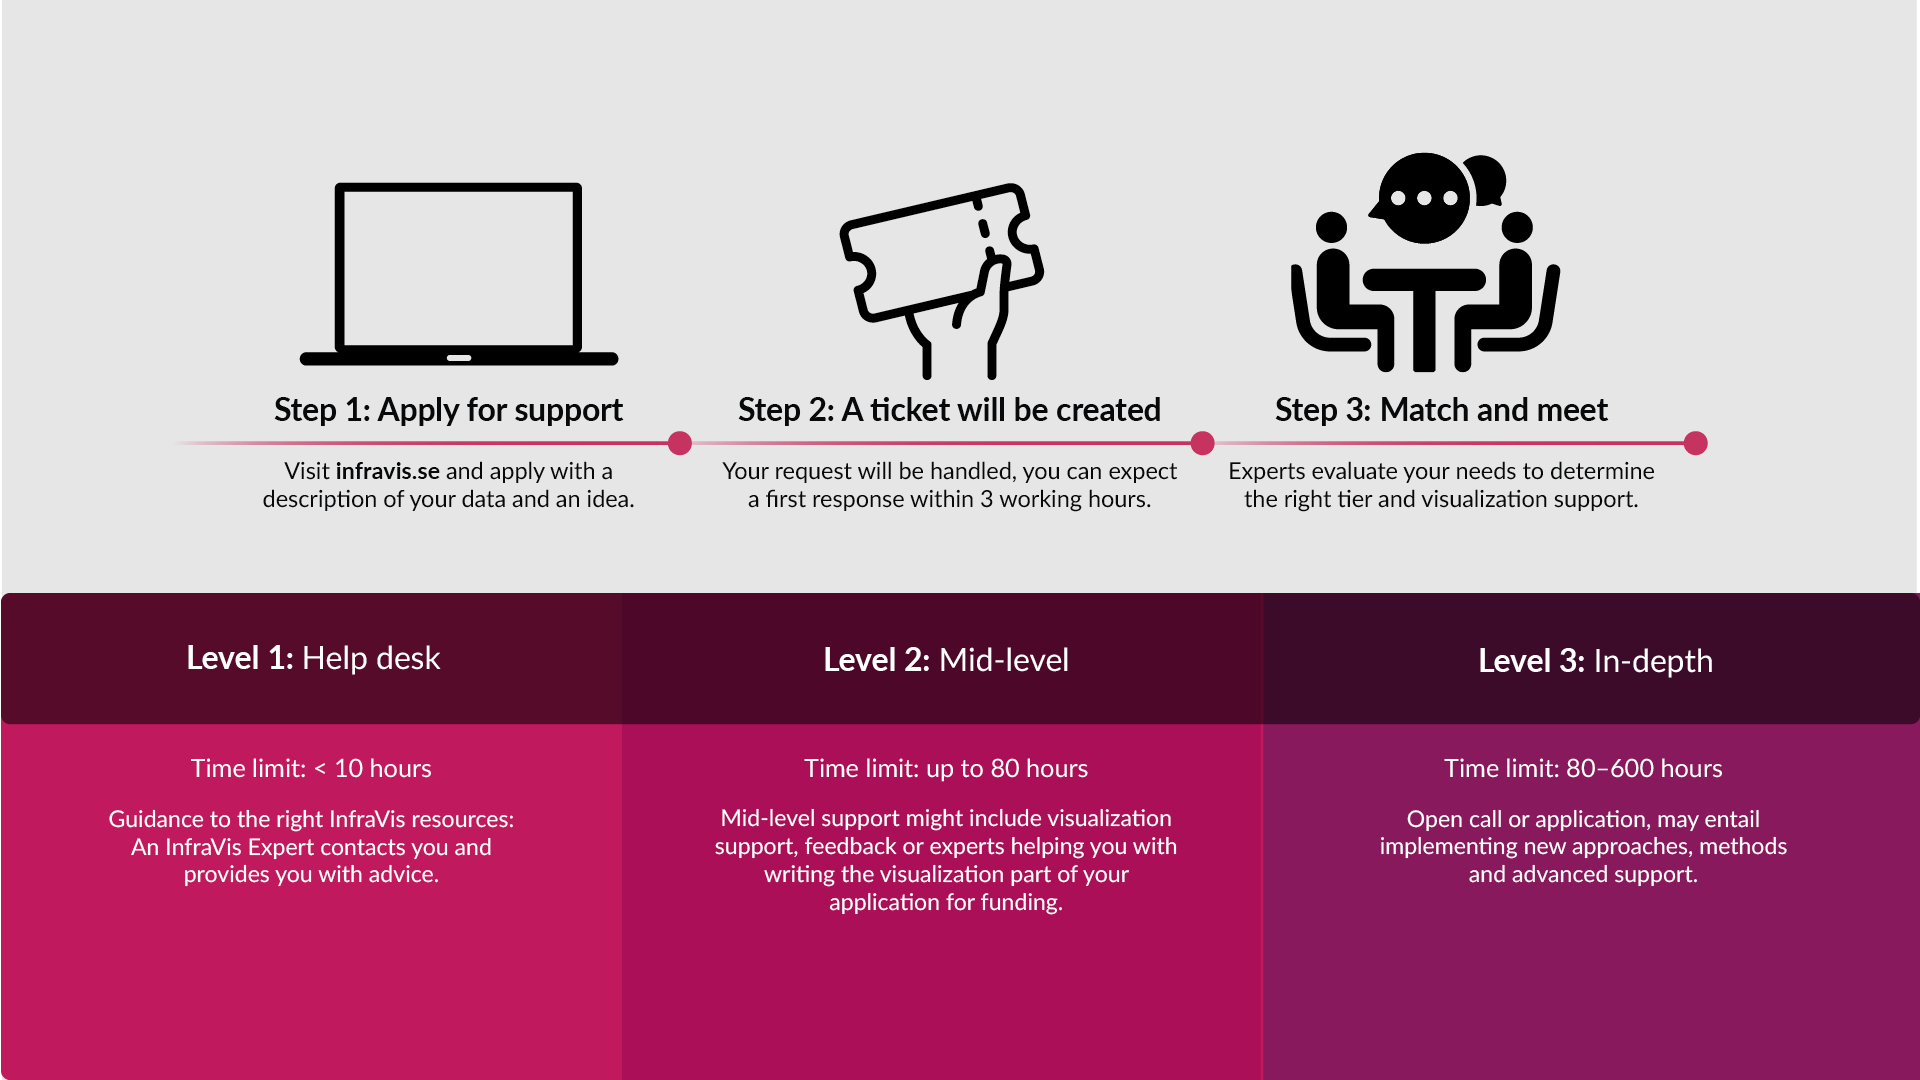
Do you have data you’re struggling to analyse or visualize? InfraVis offers hands-on support to help you take your data further. Apply for our annual in-depth support call, open 1–31 October, and collaborate with InfraVis experts to strengthen your research. Preparatory workshops are available:
- Tuesday 22 September, 10:00–12:00
- Friday 25 September, 14:00–16:00
- Wednesday 30 September, 14:00–16:00
| | | |
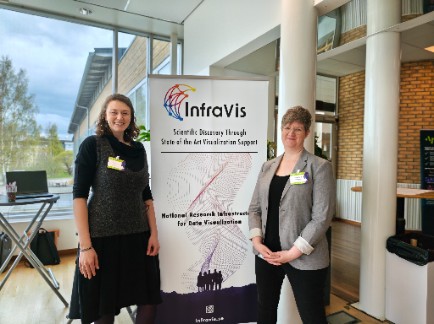
"The value of data is not determined by how much we collect, but by how much we understand. Through DataCatalyst Öresund, we are strengthening the ability of researchers, innovators and companies to transform complex data into knowledge, innovation and societal impact." - Kajsa M. Paulsson, Project Director, DataCatalyst Öresund and HALRIC, Vice Director, InfraVis and Director, CIPA.
| |
New Interreg funding for data-driven research and innovation
DataCatalyst Öresund has been approved for funding
through Interreg. With a total budget of €2.63 million, the project brings
together Lund University, the Technical University of Denmark and Medicon
Valley Alliance to strengthen data-driven research and innovation across the
Öresund region.
The project
connects industry needs with leading data expertise to turn complex datasets
into innovation and accelerate their path to market. It addresses the growing
demand for advanced computing, data analysis and visualization by linking
expertise and resources across institutional and national boundaries.
DataCatalyst
Öresund will further strengthen collaboration between InfraVis and QIM,
combining expertise in image analysis, visualization and data-driven
innovation.
The project
builds on established collaboration between InfraVis/CIPA at Lund University
and QIM at DTU, as well as networks from HALOS and HALRIC, taking the next step
in developing shared expertise, services and workflows across the region.
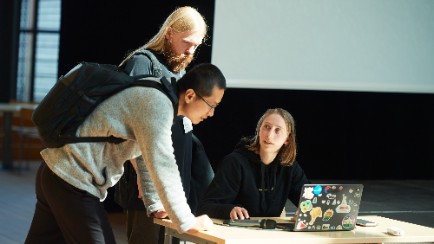
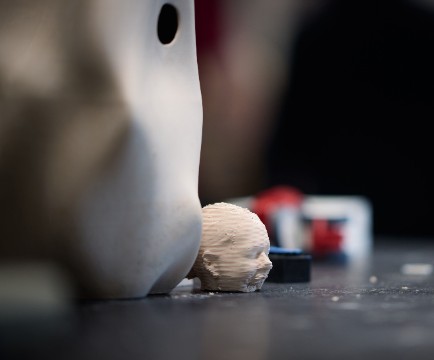
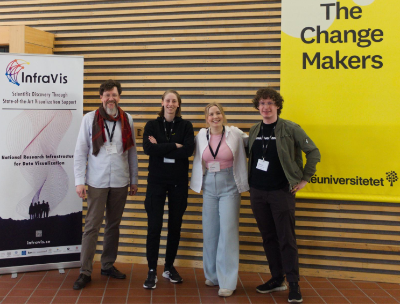
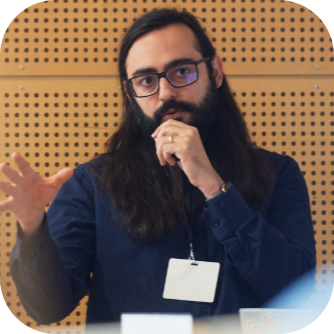
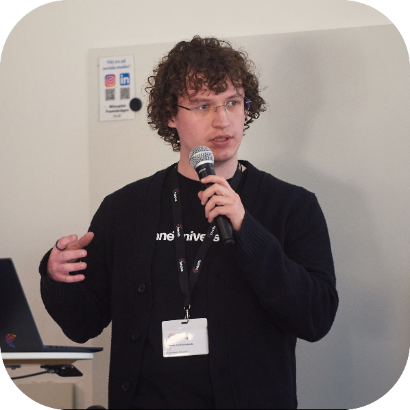
| | | | Julius Häger (KTH), Liang Zhou (MiUn), and Petra Horváth (LnU) Photo: Henrik Andersson | Production at the Design Department Photo: Henrik Andersson | |
InfraVis Days in Växjö
The bi-annual internal event InfraVis Days was held at Linnaeus University in April, bringing together colleagues from all eight nodes. It was a pleasure to see how naturally the eight nodes work together as one national infrastructure. By combining skills and perspectives, InfraVis supports research that would otherwise be difficult to achieve. Invited users presented their projects with InfraVis (ranging from deforestation analysis to archaeology), highlighting how visualization contributes to new insights in data‑intensive research.
The study visit at the Department of Design was highly appreciated and highlighted how digital manufacturing, machine vision, and reinforced learning
can support complex design processes rather than replace human involvement. | | | | Maria Podkorytova and Evelina Liliequist Photo: Anna Shevtsova
| |
InfraVis presented at several venues
Humlab at Umeå University, one of InfraVis’ eight nodes, has presented InfraVis at several occasions: lunch seminars at Kemiskt Biologiskt Centrum (KBC) and SciLifeLab in Umeå, as well as at the *DHNB 2026 conference at Aarhus University. Through these activities, they show how visualization can open up complex data, helping researchers see patterns and insights that would otherwise remain hidden.
| | | |
User trainings with InfraVis
InfraVis provides user training in various fields. This spring, it has included two workshops, “Visualize Your Research Using Python”, held led by professors Ingela Nyström and Anders Hast (Uppsala University).
Interactive visualizations helped researchers explore and communicate their data, while dimensionality reduction revealed patterns and insights in machine learning models.
"We worked in a more focused group setting, which created space for discussion and made it easier to explore participants’ own data" says Anders Hast. Look out for user training announcements on LinkedIn and infravis.se
| | | | InfraVis support projects
|
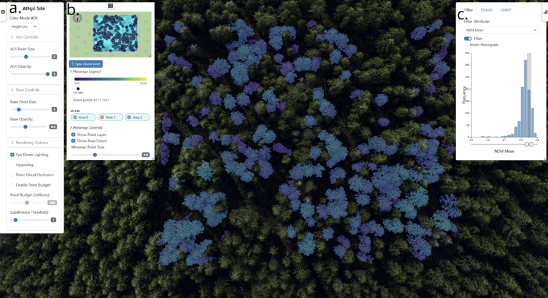
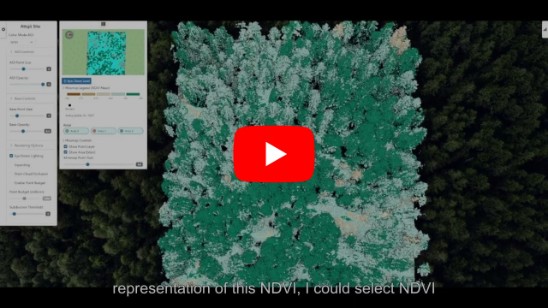
ForestVis: Visualizing Individual Tree Characteristics in Forest 3D Point Clouds Using Remote Sensing Data
Understanding forests at the level of individual trees is key for both research and sustainable management. And so, ForestVis was developed at the Linnaeus University node. It is a web-based 3D visualization system for the interactive visual exploration of forest data. ForestVis turns 3D point cloud data from remote sensing into an interactive exploration tool. It allows researchers to move between scales – from single trees to entire forest areas – using LiDAR and multispectral data. With interactive filtering and linked views, users can explore tree characteristics, identify patterns, and detect issues such as tree stress. | | | | Still from video: Ingemar Markström | |
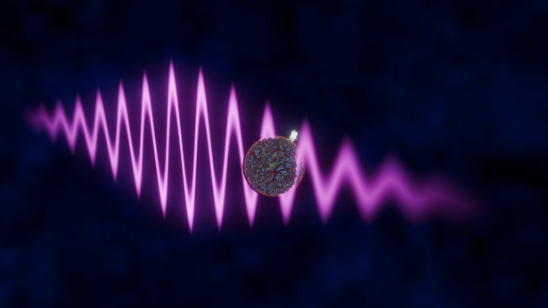
Visualizing physical interactions of molecules in macromolecular scaleA research group led by Ilaria Testa at KTH and SciLifeLab has developed a new method for measuring how molecules rotate in solution. To support its use and understanding, the team collaborated with InfraVis to produce a short explanatory video, intended for academic presentations and outreach.
The video illustrates the method in a clear and accessible way, helping researchers better understand and apply it. It was created and rendered in Blender, with molecular structures imported using the MolecularNodes add-on. | | | | Copyright: Linnéa Tjernström | | Consent forms for people with limited previous education
This project, carried out at the Umeå University node, developed visual tools to support recruitment and informed consent among refugees with limited language skills. Using multilingual explanatory videos, it improved accessibility, strengthened ethical research practices, and aligned with FAIR and CARE principles for inclusive and responsible data handling.
| | | | Still from film: Costanza Julia Bani | |
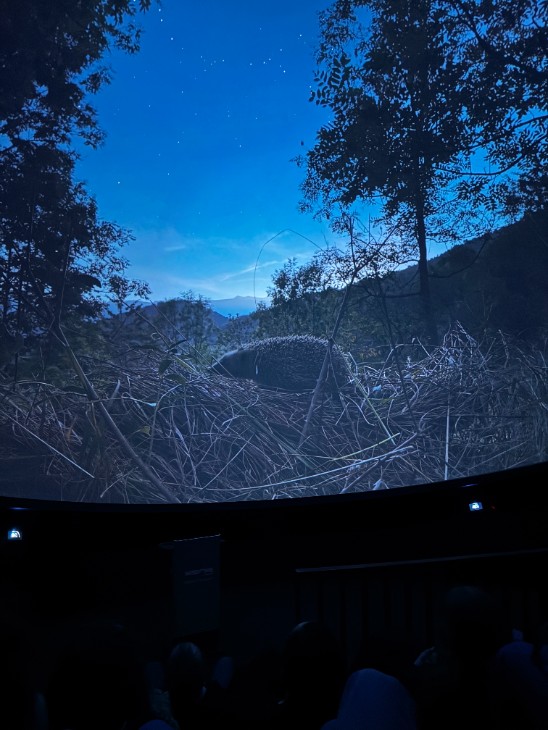
Dome production: Darkness matters
The Dome production Darkness Matters by Costanza Julia Bani, had its industry premiere at m:brane in Malmö, and InfraVis was there.
Julius Häger (application expert at the KTH node) has provided precise measurements of light
pollution at several specific locations to create so called sky glow maps to
simulate what the world could look like 100 years in the future. The idea is to explore effects of light pollution via virtual reality. | | | | InfraVis embedded expertsRobin
Skånberg is InfraVis' first embedded expert. He started working with InfraVis
in 2025 with VIAMD.
VIAMD
(Visual Interactive Analysis of Molecular Dynamics) is a molecular
visualization tool that turns molecular data into an interactive, exploratory
medium rather than a static rendering. It integrates visualization, analysis,
and computation, allowing users to explore complex molecular systems in real
time and bridging scientific visualization with molecular modeling.
Unlike
traditional viewers, VIAMD emphasizes visual analytics and tightly coupled
interaction. Visualization is not a final step but part of a continuous
feedback loop with analysis and user interaction, enabling a more intuitive
exploration of large, dynamic datasets.
Robin’s
background is a PhD in Scientific Visualization, where the topic of his thesis
was interactive visualization and analysis of molecular data. This was also
when he helped develop VIAMD. A collaborator connected Robin with InfraVis,
where he started working half-time as an embedded expert.
Having an
embedded expert enables deep support for a specific research project,
generating broader needs for advanced visualization, exploratory data science,
and complex software development. The expert focuses on one project but also
participates in node activities, sharing insights with the wider network. In
this case, a strong foundation comes from a PhD in the same domain.
In Robin’s
own words: “While my expertise lies within a relatively narrow area of
visualization, InfraVis provides an opportunity to connect with experts outside
my own domain in a broader context, allowing us to exchange ideas and discuss
potential solutions to problems at hand.
As an
embedded expert, I have the opportunity to focus my efforts on a single
project. In this regard, my role differs from that of a typical application
expert within InfraVis, whose work often spans several projects. Even though my
focus is narrower, the knowledge I acquire through developing this software can
potentially be applied to other problems. Conversely, solutions to challenges
within my own domain may come from people with expertise in entirely different
areas. My advice to new embedded experts is therefore to maintain strong
communication channels with other experts in order to exchange ideas and
perspectives.”
The setup
with embedded experts is quite rare, as it depends on several factors: project
scale and complexity, suitable partners, the right individual, and clearly
defined critical needs.
This spring
however, we have several: - Ylva Selling, LiU: Advancement of the OpenSpace Software Platform
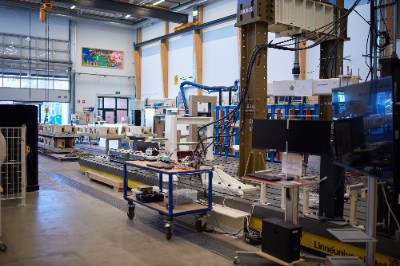
- Emanuel Larsson, LU: Beamline-integrated visualization and analytics for multiscale imaging of hierarchical materials
- Oscar André and Karl Johansson, LU: Visual analytics and quantitative imaging pipelines for spatial immunology
- Jessica Dessau: μCT-Based 3D Visualization of Blue Mussels to Quantify Ecological Impacts of the 2023 Hanö Bay Oil Spill
-
Aram Karimi, Ashely Green, Matteo Tomasini, GU: Visualizing maritime connectivity in Bronze age Europe
| | | |
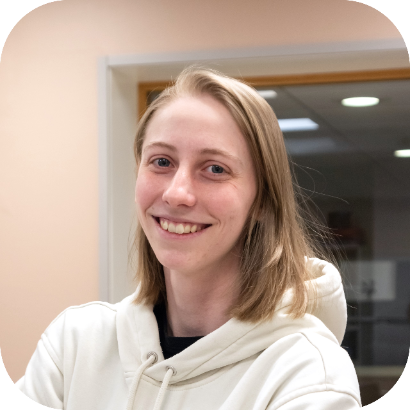
LNU InfraVis node coordinator Andreas Kerren with application experts Petra Horváth, Karen, and Maciej Jan Korzenecki
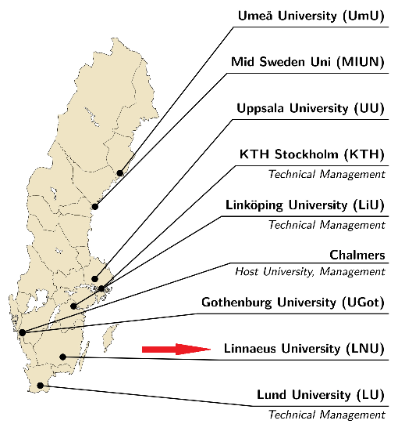
Photo: Henrik Andersson | Lab facilities at Linnaeus University, Department of Design Photo: Henrik Andersson | | InfraVis consists of eight nodes, based at nine universities, from Umeå in the north to Lund in the south.
| Spotlight on the Linnaeus Node
Combining visualization research and hands-on support
The InfraVis node at Linnaeus University brings together a small, highly specialised team working at the intersection of research and application. With expertise spanning information visualization, visual analytics, interaction design, AI-supported systems, and immersive technologies, the node supports researchers from a wide range of disciplines.
What sets the Linnaeus node apart is its close connection to an active research group in visualization. This allows the team to combine practical support with a deeper understanding of how visualization helps people explore and communicate complex data. Rather than focusing on one domain, they work broadly, from environmental science to digital humanities.
The node emphasises close collaboration with researchers throughout projects, using iterative methods such as workshops, prototyping, and continuous feedback. By focusing on tailored visualization strategies and working across nodes when needed, the Linnaeus team helps ensure that visualisation supports both analysis and communication.
| | | | The InfraVis Application Experts at Linnaeus UniversityClaudio Linhares - associate professor in computer science at Linnaeus University. His work focuses on network visualization, digital twins, and epidemiology, helping researchers understand complex relationships in large datasets. Claudio supports projects ranging from network analysis to public health and disease modelling, where interactive visualizations reveal patterns that are otherwise difficult to detect. His expertise is also increasingly used in digital twin environments, supporting simulation, exploration, and decision-making in complex systems.
Petra Horváth and Maciej Korzenecki.
A distinctive feature of the Linnaeus node is the close involvement of student developers, who work alongside researchers and application experts on real research projects: Petra Horváth and Maciej Jan Korzenecki, both graduating from the Software Technology program at Linnaeus University and continuing into the master’s program in Interactive AI Systems, contribute to visualization projects spanning different research domains. Through InfraVis, they gain hands-on experience in scientific software development, user-centered design, and interdisciplinary collaboration. Working directly with researchers gives student developers the opportunity to translate scientific questions into interactive tools and visualizations while also bringing fresh technical perspectives into research collaborations. The model benefits both sides: researchers gain development support, while students gain experience working on real societal and scientific challenges.
| | | |
Online workshop - save the date
Exploring Data in the Humanities and Arts: Working with digital sources, materials and objects in the humanities and the arts.
In early September, InfraVis will host an online workshop for researchers in the humanities and the arts interested in visualization support. The session will showcase InfraVis perspectives alongside a user case, and offer space for questions and discussion. More details will follow. | | | | | | Follow InfraVis on Social Media | | | | | If you have news, suggestions or ideas relevant for InfraVis and data visualization, please let us know by emailing info@infravis.se Unsubscribe | |